Day 28 Trading with Ricky
TRADING JOURNAL
3/7/20241 min read
Day 28
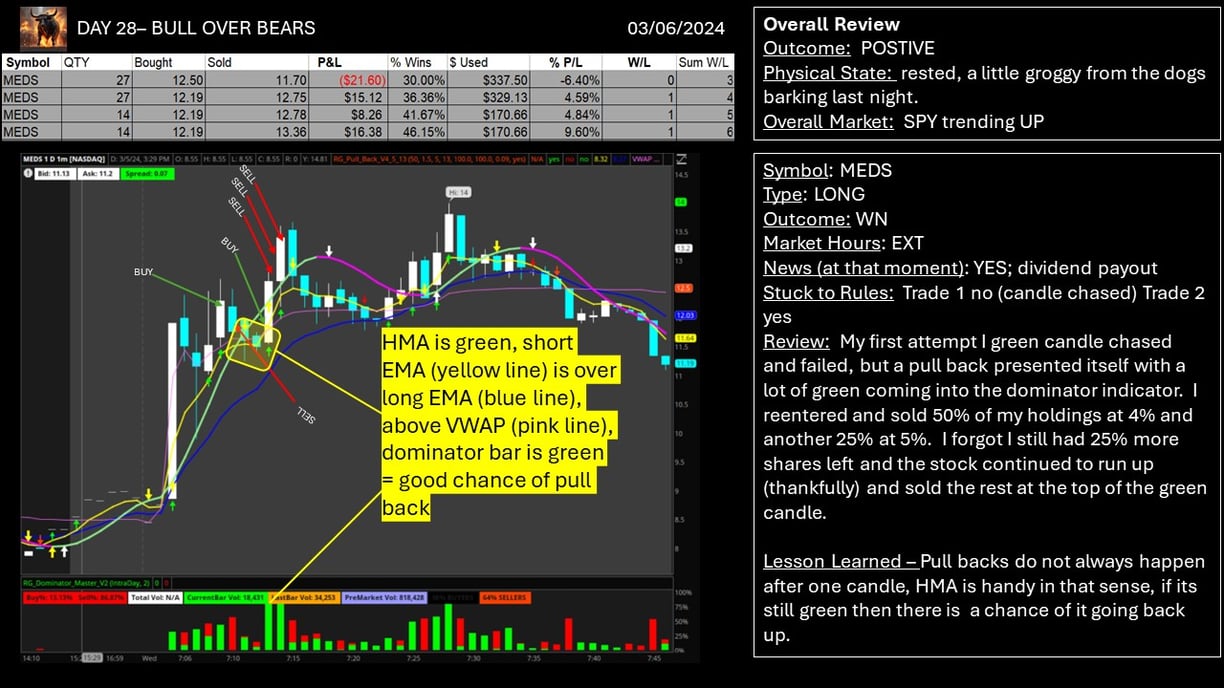
This morning brought some intriguing twists. Initially, my venture into MEDS (ticker symbol) fell short. However, Ricky's indicators painted a different picture, signaling a buy (green bar on dominator, short over long EMA, HMA green, and positive volume flow). Despite enduring a 6% loss, I remained observant as multiple indicators suggested a buying opportunity. A subsequent green candle prompted me to reconsider, leading to a beneficial pullback. I've learned the importance of tracking a stock when its price aligns with Ricky's indicators, as depicted in the image. This enables me to gauge if a pullback might occur after a delay of a candle or two (or in this instance, three). Additionally, I experimented with scaling out of a position, hence the three sell markers on my graph. This strategy allows me to maintain some investment while securing gains, swiftly exiting when growth prospects diminish to prevent losses.
Get in touch
Contacts
bulloverbears3@gmail.com